Built an interactive Netflix dashboard in MS Excel using Pivot Tables, Pivot Charts, and Slicers to analyze 6,000+ titles across 543 locations.
Key Achievements: - Derived insights on content distribution (Movies vs TV Shows), top genres, audience ratings, and global presence. - Identified content growth trends (1925–2020) and delivered a visual report showcasing viewer preferences and market expansion.
Demonstrating Content Distribution with Python
While the original dashboard was built in Excel, below I recreate the Content Distribution pie chart using Python (pandas and matplotlib) to demonstrate my cross-platform analytical skills.
Code
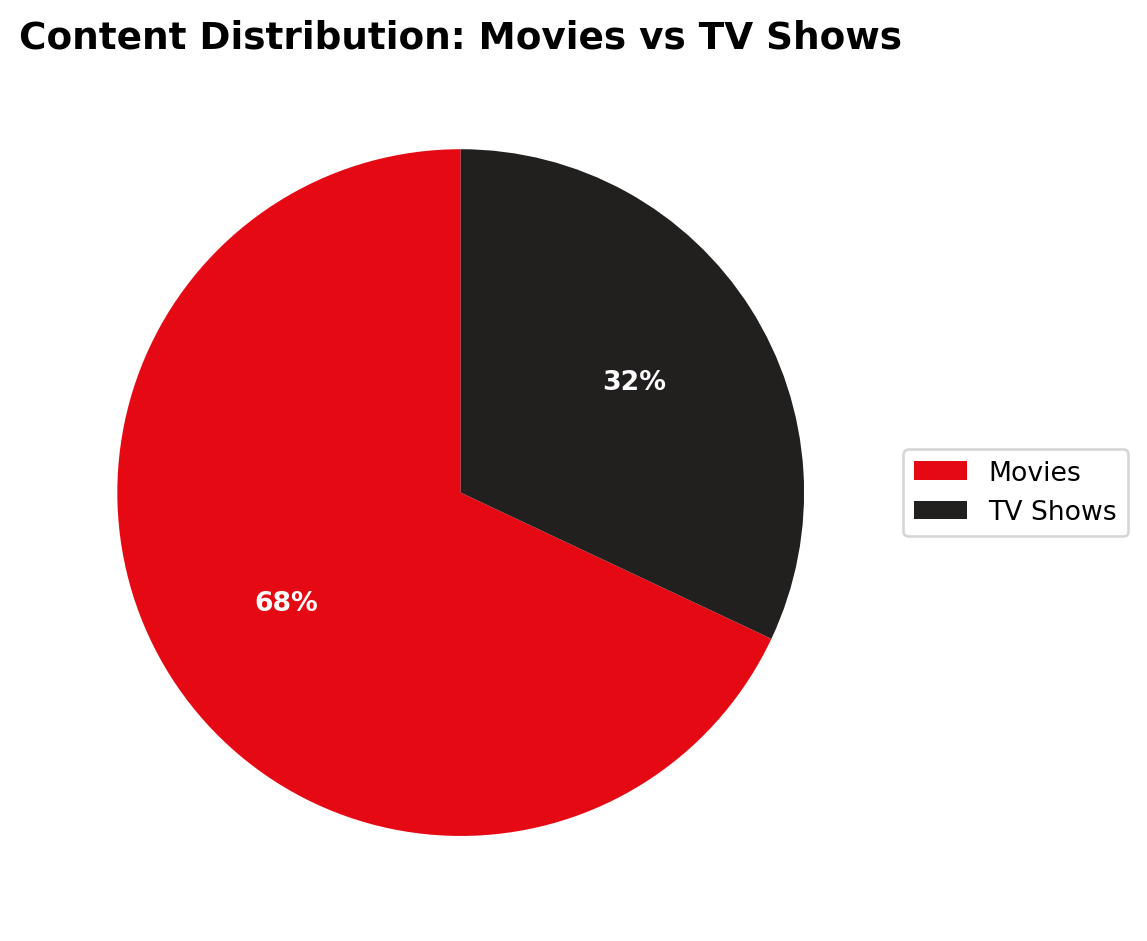
import pandas as pdimport matplotlib.pyplot as plt# Recreating the statistics found in the dashboarddata = {'Category': ['Movies', 'TV Shows'], 'Share': [68, 32]}df = pd.DataFrame(data)# Visualizing with matplotlibfig, ax = plt.subplots(figsize=(6, 6))colors = ['#E50914', '#221F1F'] # Netflix brand colorsax.pie(df['Share'], labels=df['Category'], autopct='%1.0f%%', startangle=90, colors=colors, textprops={'color':"w", 'weight':'bold'})ax.set_title("Content Distribution: Movies vs TV Shows", fontsize=14, weight='bold')# Add legend outsideax.legend(labels=df['Category'], loc="center left", bbox_to_anchor=(1, 0.5))plt.tight_layout()plt.show()
Figure 1: Netflix Content Distribution Breakdown
As illustrated in Figure 1, Movies make up the predominant share of the content catalog.